
I had covered the monthly Scorecard for Mobile Advertising Reach and Targeting (what a mouthful) from Millenial Media before (see here for the May figures), so here’s an update on this (and note that these are all US-only figures). The firm covers just under 50m users, which seemingly represents 79% of the mobile web (but only 11 of the top 25 sites as per Nielsen). However, it should provide for a very decent overview of the state of advertising on the mobile web. So here it goes:
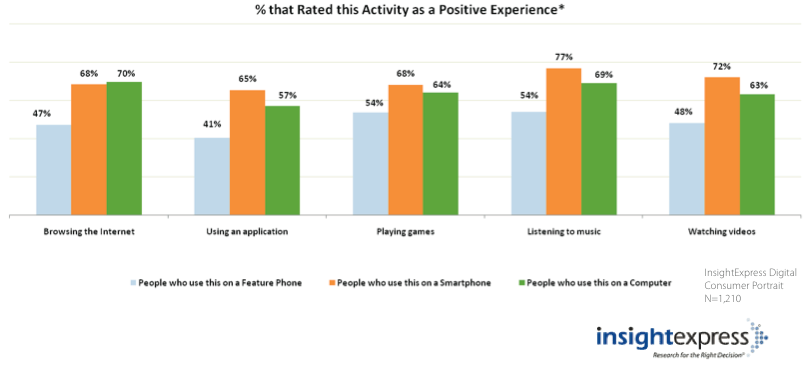
The first really noteworthy piece has not actually anything to do with advertising but with user satisfaction: would you actually have thought that users enjoy most things more when done on their smartphone than on their computer, including playing games and watching video? The computer only leads (and by a meager 2% higher rates) for web browsing (70% vs 68% on smartphones). Wow! Here’s the graph:
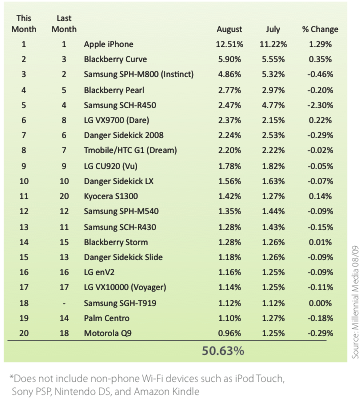
This is very encouraging and probably also owed to the market leader when it comes to ad impressions received on a mobile device, which is – moan – the iPhone of course. The last snapshot I covered had the Samsung Instinct in front but this has slipped back to a still respectable #3 now. Blackberry’s Curve takes 2nd place. Here’s the top 20 list:
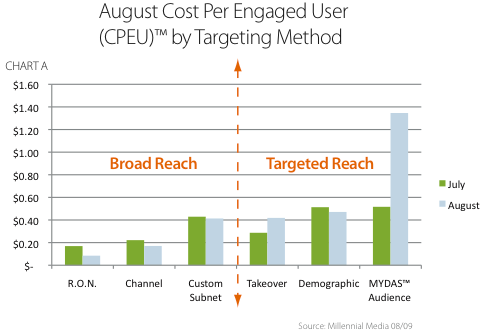
Compared to their old format, Millenial Media is no longer spitting out a comprehensive chart showing the CPEU (cost per engaged user) per demographic/targeting method. They have adopted their proprietary “Mydas” tool, which appears to enable them to mix things together in an optimal way. It is understandable since this is their business but the look under the bonnet was great. Alas, no more. So here’s what we still learn:
- iPhone and iPod Touch impressions are still growing with double-digit numbers (month on month they grew 68% in June, 29% in July and 15% in August).
- Average monthly page views is 111 (up 5 views).
- The top 20 phones (see above) make for 50.63% of all device traffic, which is drop by nearly 4% compared to the previous month.
- A whopping 26.15% of all ad impressions were achieved on devices on a WiFi connection (bandwidth is king!).
- Cost per Engaged User for audience targeting increased very significantly from ¢52 to $1.35, which is owing to Millenial’s aforementioned Mydas thing (or so they say). Most CPEU rates decreased however. Here’s the chart:
So what does it teach us? Well, due to the new format unfortunately less than previously… but then: I’d love to have that Mydas touch… 😉