
The good folks of Millennial Media gave me a sneak preview of their May Scorecard for Mobile Advertising Reach and Targeting (yes, they call it SMART…), which looks at the US mobile advertising market, and then my daughter broke her arm and my blogging activities (and a lot of other things) took a time-out…
Anyway, Millennial reaches 73% of all mobile Internet sites (which they claim makes them biggest), which makes it a fairly comprehensive overview. And there is a lot of interesting data buried in this brief piece of research.
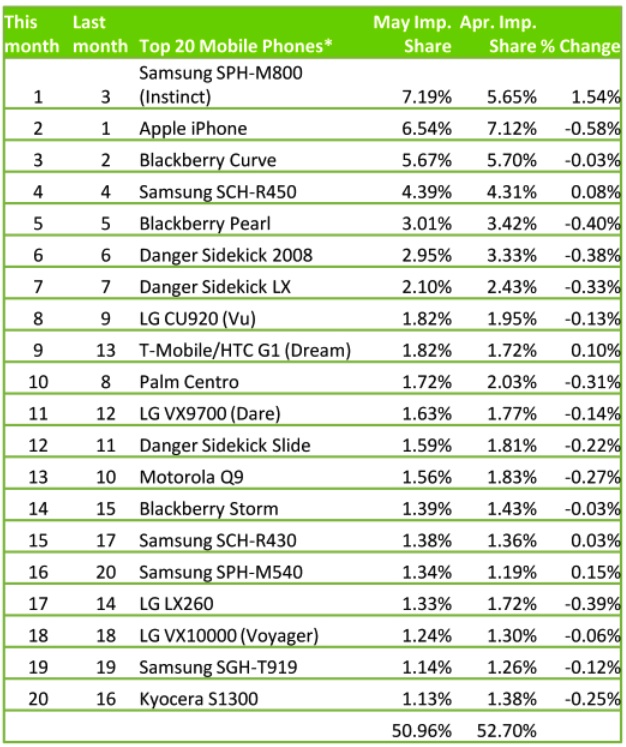
So, for May 2009, the handset on which most ad impressions were recorded was not the iPhone but the Samsung “Instinct” (otherwise known as the SPH-M800). The iPhone was on #2 ahead of the Blackberry Curve. A full list of the handset breakdown looks like this:
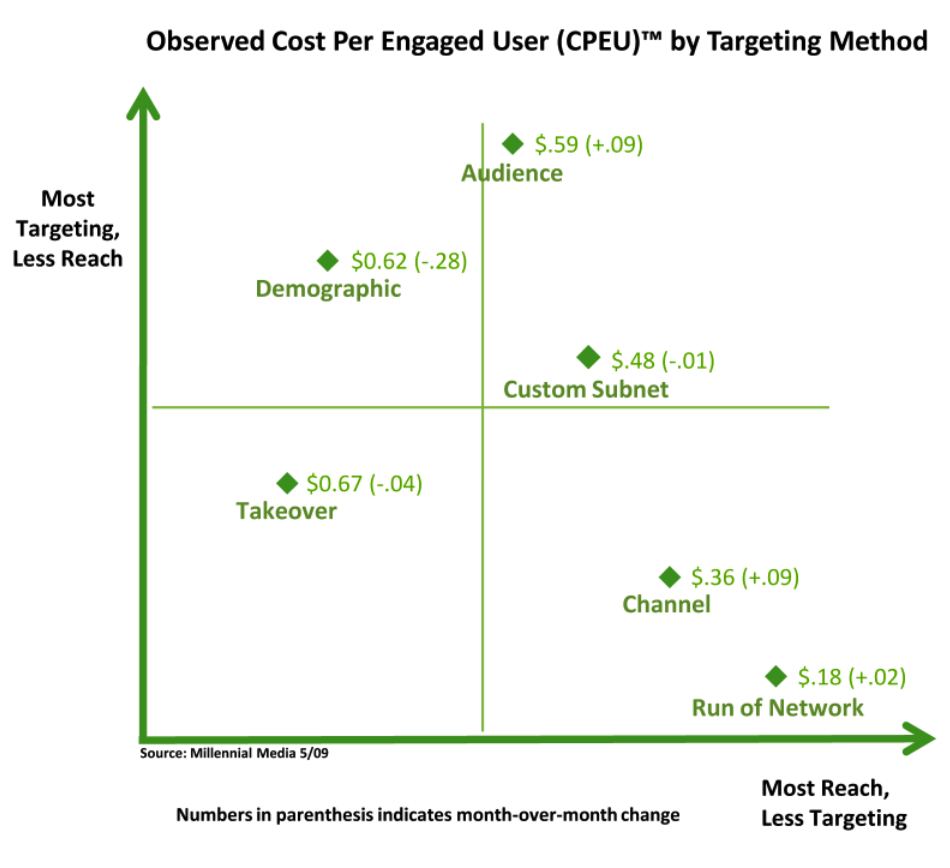
On the advertising front, we’re seeing some interesting metrics on cost per engaged user depending on the various measures included. Advertisers appear to be trying out a variety of approaches. Interestingly, the cost per engaged user for a campaign focused on a specific demographic has dropped very significantly (by ¢0.28 or c. 45%). Is this a sign of a higher take-up? Here’s a graph showing the details:
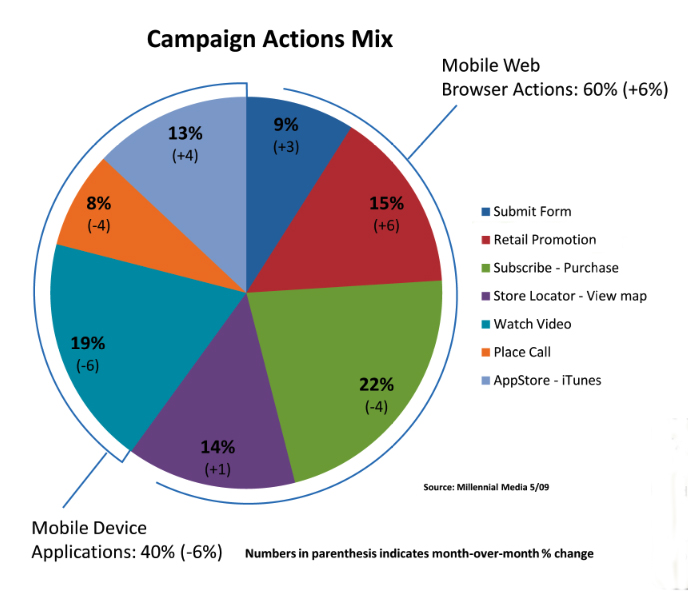
The mix of campaign activities is also interesting and shows that the sector seems to be coming of age. C. 60% of the campaigns (or committed budgets) were dedicated to the mobile web (browser) with the balance using some form of dedicated applications. The app store has its own category already and use of it (or rather iPhone apps) rose by 4 points to an overall 13% of campaigns, which is significantly higher than the iPhone’s footprint. However, I am sure more than 13% of art directors and their clients use iPhones, so maybe this is why. Or of course the iPhone could simply be a device (and the apps to go with it) that makes it easier to engage with users. Oh, what news… 😉 So here’s the final graph I’ll share with you, namely a chart showing the splits:
2 Pingbacks